
Know your numbers
Dashboards, reports & exports across every module with Neon Analytics
One question, asked once, answered across the whole business. Revenue, orders, utilization, no-shows and outstanding balances all come out of the same records the operational screens read, so a dashboard here cannot disagree with an invoice there.
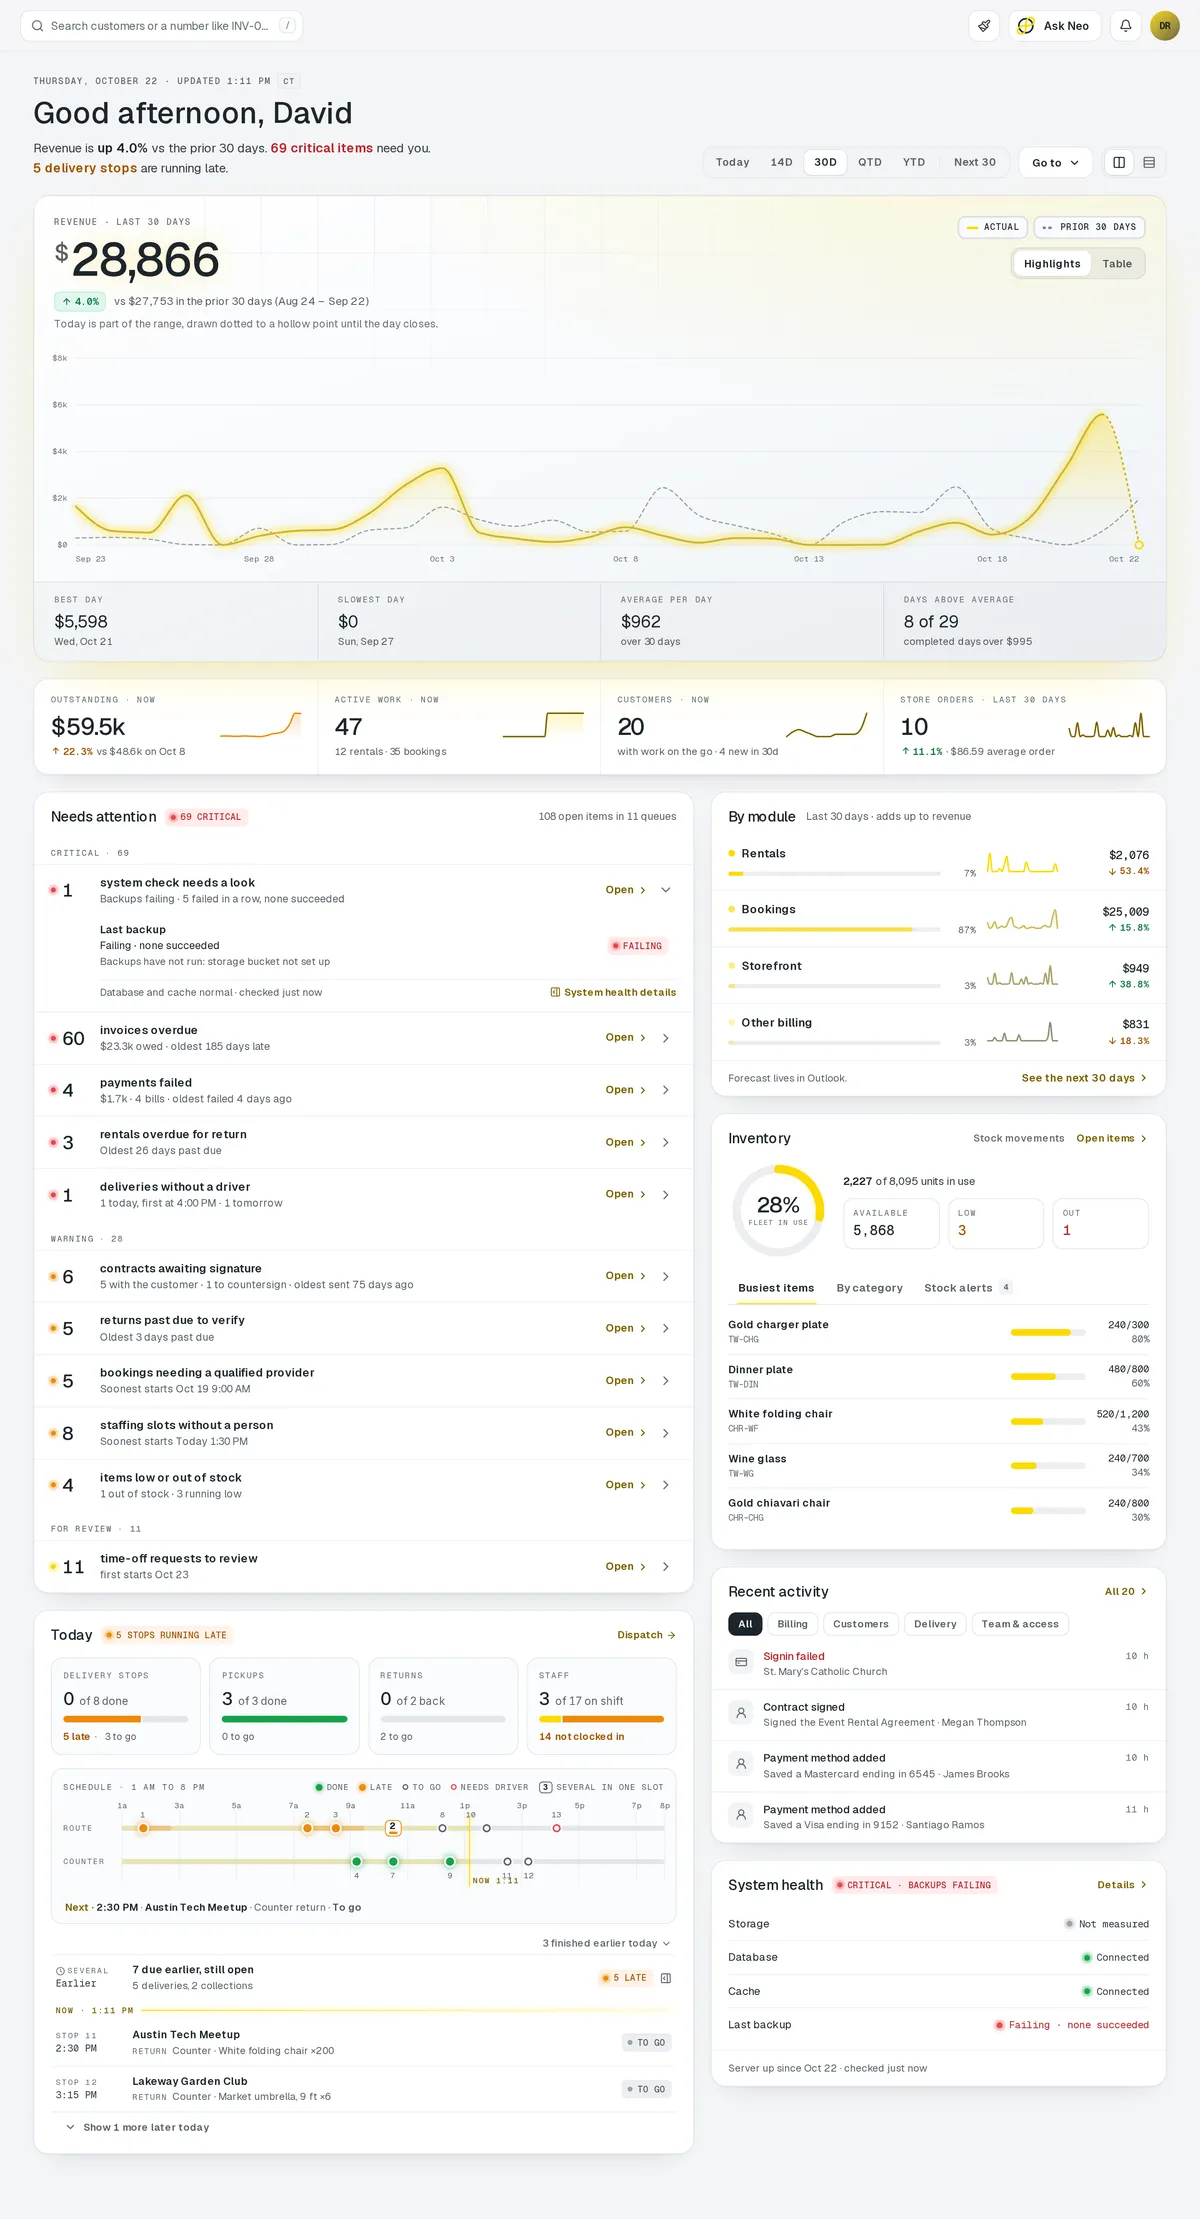
Analytics that's connected from the first record
One question, asked once, answered across the whole business. Revenue, orders, utilization, no-shows and outstanding balances all come out of the same records the operational screens read, so a dashboard here cannot disagree with an invoice there. Build the views you want, break them down by segment, period or module, schedule them to arrive in an inbox on Monday morning, and export anything an accountant asks for. There is nothing to join, nothing to reconcile, and no month-end afternoon spent making three tools agree on one number.
How it works
One month's revenue, from every module that earned it.
Store orders, rental contracts and bookings add up on one dashboard, with nothing exported or joined by hand.
Analytics · 4 features
Every feature you need, all in a single system.
- 01
Cross-module dashboards
Revenue, orders, utilization and balances come from one set of records, so numbers agree.
- 02
Scheduled report delivery
Pick the reports and the recipients, and they land in the inbox on schedule, Monday 8am or whenever suits.
- 03
Segment & period comparisons
Break any view down by segment, period or module to see what changed.
- 04
CSV & spreadsheet export
Export anything your accountant asks for, in the format and columns you set.
What makes Analytics in Neon fit your business?
All of it is configured from the admin panel. No developer, no plugin, no second tool.
- Custom dashboard layouts & saved views
- Metric definitions & calculated fields
- Report schedules & recipient lists
- Default date range & comparison period
- Per-role dashboard visibility
- Export format & column templates
Analytics works with the rest of Neon
Nothing gets re-entered between them.
Or just ask Neo.
Press ⌘CtrlK on any screen and say what you want. Neo finds the screen, reads your live numbers and fills the form in. You press submit.
Check out other Neon features:
Forecasting
Demand projections, stock cover, price suggestions & revenue outlook.
Learn moreSmart pricing
Machine-learning price estimates and stock outlooks.
Learn moreInventory
Track stock, manage products, automate reorder points.
Learn moreRentals
Combos, options, rules & automated billing.
Learn moreBookings
Combos, options, scheduling & confirmations.
Learn moreEmployees
Staff records, time clock, scheduling & PTO.
Learn moreIt's time to run Analytics on one login.
Every account starts with a short conversation. Tell us what you run and we'll set it up with you.